Wednesday, August 28, 2013

Live Cattle


Live cattle had big town trend all year, with grains, could be time for big reversal.
A developing upward channel taken form on the daily chart. 1yr POC support so far (green solid horizontal line on VP) and 89VWAP/EMA and 50 day SMA support @ 126.255 but channel support meets HVAL & LVN @ 125.50.
The 1hr looks like could indicate smooth entries @ TL & 90day POC.

Thursday, August 22, 2013

Nikkei & Cotton

Nikkei may be attempting to break thru this recent declining wedge pattern. HVAH and composite 1yr VAH could be on tap as targets near 15000.

Red highlighted box could pose intermediate TL resistance @ 14250 - 14300 zone.

Cotton made a crazy spike higher, new high on continuous contract, then the divergence in RSI clearly rang the bell there for the short of the month (missed entirely.) Looking at the sharp pullback, seems very likely the TL support and breakout from last wedge support lines up at 83.00 - 83.20 area, which is also a LVN pm composite VP. Swing lows at 82.50/60 and 200d SMA 82.43 next level of support and line in sand if TL breaks brief period of swing low in June of 78.94 is huge support level and major crater in composite VP.

Sunday, August 18, 2013

August 16, 2013 - Some updates

S&P 500 under pressure, tapering fears getting permabulls a bit scared that the neverending stock fuel going to come to a close?

But even a retracement to the support zones in the daily & hourly charts suggest this would not lead to massive crash. (Being a perma-bear, ignoring reality and fundys; just charting.)
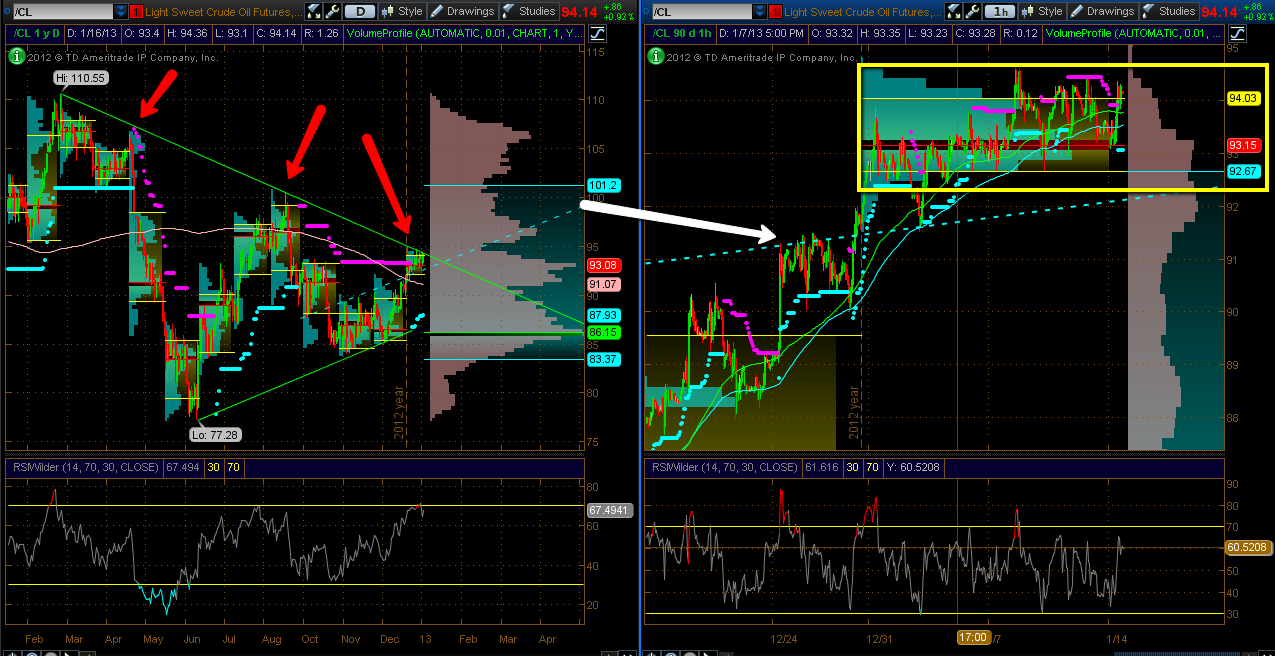
Daily chart:
1hour chart: Shows why today's levels were near a support zone. Looking to fade rallies into EMA/SMAs above (144/100) ~ 1675
NQ has similar theme of selling rallies from here on 1hr chart, but long-term support zones clear on daily:
Looking @ EMA/SMAs for selling on 1HR, targets 90d POC highlighted
Dow showing greater weakness than ES or NQ; low volume node (red arrow) and likely Fib retrace level 78% @ 14757 where last Inv. H&S resulted in quick rally to all time highs.
Russell was strongest & hit hardest today: TL support & HVAH would be support levels.

The 1HR chart shows good break of H&S pattern:

Big moves in treasuries are likely not over; cannot consider buying the lows, will eye pull backs to sharp TL for shorts - long term support levels @ 122'315
CL - Oil bulls were tested only 8 days ago, now will be watching test of highs for break out higher or reversal signals.
Wild action today, after weekly new highs, collapsed lower to Aug POC/moving avg levels, climbed right back during rest of afternoon. Same concept as above; watching for test of new highs. The one that got away was the Inv. H&S on Aug. 9 @ 104.5 area.
Nat Gas has been all over the show this year; very big ranges, nearly DB and pulled back quickly this week, looking to possibly fade rally into HVA @ 3.50 levels or naked monthly POC:
1HR shows a better reversion into value where selling should be valid around 3.50:

RB Gasoline - will watch closely for another RSI signal @ highs around the HVA in the 3.05 range; perfect sell signal in Feb.


No indication of oversold yet on 1hr, will be eyeing NPOC from July above daily target as key resistance.

HO - heating oil having some unusual activity from a seasonal perspective, following WTI/Brent higher.  

Daily resistance BO may be coming if WTI/Brent continue breaking higher. 
 GC - gold bulls back in form again.. likely to be horribly disappointed. I may dedicate a larger post, for the record on this one.
Daily chart, indicates 3 key levels of resistance, of swing highs $1425 & $1485, NPOC not far off from here @ $1383. The developing channel looks more a bear flag.

  The 1HR chart has nice confluence with June NPOC @ 90day POC being in same level.
Silver clearly under heavy short squeeze more so that gold. They move in similar fashion, so when silver's drop was more exaggerated, this comes as no surprise. Eyeing the LVN @ TL as major resistance.
HG - Copper could be the industrial metal that is poised for a big move to upside; while directly connected heavily to growth in China (which I am unconvinced is rebounding completely) the inv. H&S break out could be under way.
 HG 90d trading way above value; so longs would be optimal @ MA & Aug. POC levels.
 PL - platinum definitely broke out over TL, but is reaching key resistance zone of levels; LVN and HVAL should halt this run for a pullback, but 1yr POC could be in the cards if shorts continue to scramble.
The rising channel resistance is nearby as well.
PA - palladium is a jittery thing; three bull flag BOs all pretty good moves. Will eye for pull-backs to 1yr POC @ 734.


Tuesday, January 22, 2013

Jan 22

Last week took some aggressive positions.

LE long @ 1yr POC & 90d POC.

Long 6J - legged in along the way down. Saw SERIOUS heat at one point. RSI Divergence on 1hr chart gave confirmation. Still long 1 @ .011090

Bought .011201, sold .011195
Bought .011169, sold .011213
Bought .011128, sold .011267
P&L = -6t, +44t, +139t total 177t or $2212.5
Runner still +194t = $2425.

Similar trade, short NKD. Also took a bit of heat, but finally got the pullback I was seeking.
Sold 10905, 10910. Bought 1 back @ 10760, 90d POC +$725. Runner still going. Watching Jan VAL for support levels. Runner @ +300 (60t) = +$1500.

Still short ES @ 1474. Good signal @ 90d VAH. nPOC still target on one off daily MP and Jan POC @ 1456 2nd target.

Eyeing a NQ short. Clearly a strong resistance level. RSI divergence. H&S topping pattern on daily. Offering 2 @ 2746.75. Would leg into more at higher prices; or add on uturn sell signal.

Wednesday, January 16, 2013

January 16, 2013

ES has been in a heavy congestion area. Looking for a retest or failed test of high @ 1371.50 and uturn short. Gap fill target lines up beautifully with 1yr VAH level, which should act as support ~ 1420.
NQ double H&S topping patterns. AAPL's recent struggles have been curtailing NQ, 1yr (left) pretty firm H&S developing and confluence with 1yr VAH. 90d, hourly chart (right) mini H&S. Will be eyeing uturn shorts off 90d VAH @ 2750/2740 levels.
VIX may not have completely hit rock bottom yet, but lack of volume on ES and VIX just drifting away any negative news could flush markets and spike VIX. Looking at long calls on the short-dated side, or longer-term call spreads in June expiry. Target #1 14.56, Jan reversion; target #2 17.66 90d reversion, max target 20.41 1yr reversion.
ZN declining channel. Distance consideration for entry short @ 1yr POC 133'172
CL major wedge developing on daily chart. Breakout higher seems imminent (left), but 90d hourly chart showing major consolidations. 101 upside breakout target (VAH) and pullback entry 91.00.
DX small wedge on daily, looking for move away from POC to test edges (left) and hourly chart buy zone 79.40 - 79.60 level (right)
NG Missed breakout Monday (right chart, yellow box) - pullback level to 3.3550 swing low test perfect spot to consider long. Daily chart breakout of bull flat (left).
SB H&S formation breaking down; possible VAL support on 1yr (left) chart and swing low test (lower yellow box on right chart) of hourly. move to 90d POC 19.30 seems very strong, also 19.49 daily POC.
CC Heavy consolidation @ 1yr POC/VAL. Jan VAL 2219 & 1yr VAL 2209 should be spot for uturn long

BIDU channel trade. Could see a pullback to lower levels @ daily POC. Recent action attracted to 90d POC, but cannot make newer highs (right chart).

Monday, January 14, 2013

Jan. 14

A major range breakout could be in play for the 5 year Treasury (ZF) - watching daily chart for a break from this consolidation.


Wednesday, January 9, 2013

HE update

I really did drop the ball on the hog trade. As I mentioned about missing HE (hogs) short. I was looking for 87.500 short entry.

Currently trading 84.55 - a runner would be +$1180.


Jan. 9 - ES short

Managed to find an entry on the selling tail. Sold 1457.50.


Covered 1/2 position at Jan. developing POC 1454.00, stop moved to b/e and targeting VAL in Jan 1448.50.

No other updates.

NEM

Without delving into the fundamental analysis yet, Newmont Mining may be an excellent play at current levels. I believe gold will come back into favor, possibly testing $2,000 an oz. in 2013. NEM as a miner should stand to benefit from that and it pays a nice 3% dividend while you wait for capital appreciation.

Big big picture. 3year weekly chart POC is much higher and we could be looking at a major base developing. I see this as excellent risk:reward opportunity over the course of the next 3 months to 1 year time frame.

The base developing on the 1 year chart also shows the basing triangle with a defined risk either @ 42.95 low or even 42.80 3 year low.

I first started eyeing this when RSI divergence emerged (yellow box). 90 day profile shows price is balancing around its POC ($45.24). I am looking for a pullback to December nPOC for an entry. October nPOC target (red box) would be in line w/ Weekly POC levels ~ $54 - $55 range.


I am even considering legging into a small (1/3rd size) position at these levels and adding @ December POC.


http://www.newmont.com/

Tuesday, January 8, 2013

Jan. 8

Been a while since I posted anything. Updates are sorely in need.

ES - Major New Year gap blast higher. (As are all index futures listed below). Very strong balancing range @ 90d VAH and Jan VA - 1459/1448. May be looking for an exhaustion spike higher to sell or breakout lower to sell. Not initiating longs at these levels. JBTFD extreme low @ 1yr POC or 90d POC 1403/1406 levels
NQ - same theme. POCs 2644/2651
YM - Trading @ 90d POC 13280, pull back to 1yr POC 12960 better level
TF - Above 52week highs. Nothing here except pullbacks to POC 823/821
ZN - Hints of reducing QE sent all I.R products lower. Bull flag channel developing on daily. http://screencast.com/t/xldNklb94DCu
ZB - Similar pattern as ZN, Closing in a 1yr VAL.
ZF - Very range bound between 1yr VAs
CL - Broke above 90d rising channel, still long-term triangle forming on daily chart. Aug monthly NPOC and highs definitely seem in range over $96 http://screencast.com/t/u8Td6aySrI
NG - Still young forming Jan VA balancing around 90d VAL
RB - Daily triangle suggesting breakout over 2.85
HO - Bull flag on daily; range bound on hourly between 2.98 & 3.06
GC - Major pullback intraday buying opportunity @ 61.8% Fib @ 1629; expect balancing between 1640 and 1675
SI - Similar pullback to gold; needs to break range between 29.5 & 31.5
HG - No opinion.
PL - No opinion
PA - Missed short region @ 712, 1yr VAH; Jan VAL/POC developing as support. Also 38.2% retrace from Oct rally.
6E - Major move off 1yr VAH. Dec. POC is pretty wide range bound region of 1.3155 - 1.3025.
6A - Very range bound in Jan w/ major collapse and pullback into VAs. Eyeing 1.0480 R level
6B - Major pulback from 52 week high. Jan profile balancing around 90d POC 1.6035, watching for dips.
6J - May have missed the ultimate dip. Looking for pullback to .00114
6C - Daily balancing range around POC; 1.0150 - 1.0003
6S - Balancing around Dec. POC
6M - After downgrade rumors, snapped back violently; profile and price action balancing around Dec/Jan POCs and VAH on hourly.
6N - Still major rising channel on daily. No opinion.
DX - Strong rally from 79. 121, No opinion.
ZC - Daily bull flag. No opinion.
ZW - No opinion.
ZS - 90d VAL could be developing as support. No opinion now.
ZL - No opinion.
ZM - No opinion.
ZO - Broke declining channel.. 1yr VAL next level @ 320\
SB - Potential inverse H&S on daily.
OJ - No opinion.
KC - Watching Dec VAL under 144.
CT - No opinion.
CC - Watching 1yr VAL @ 2211.
LE - Still hovering @ 1yr VAH. No opinion currently.
GF - No opinion.
HE - No opinion.
LBS - No opinion.
NKD - No opinion.