Some observations in a variety of contracts. First stock index futures.
$ESH6:
Sharp pullback this week found support Friday near some previous zones. Watching next week for a break below Friday low, next support at 1849-52 zone.
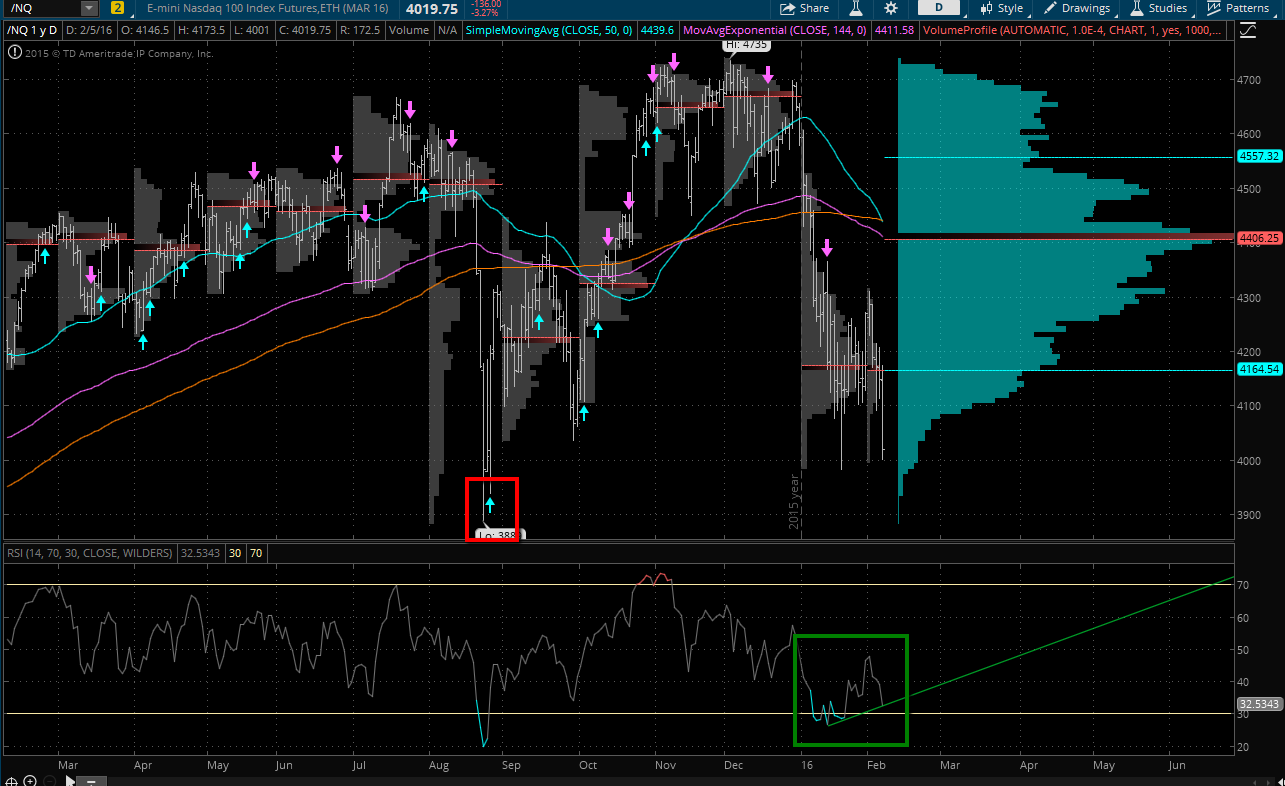
$NQH6:
The ugliest of the indexes here. Didn't quote reach that January swing low, but came darn close. A break below that (3983.50) would require looking bigger time frames to locate support.
Daily suggesting next levels of swing support come at 3958.75 & 3908.25.
$YMH6:
Not as ugly as previous, with lower support coming near 16000 & 15875:
$TFH6:
Finding nice support zones, where next level lower comes around 978
$NKDH6:
After previously finding support at the 61.8Fib and bouncing, now have broken thru and next support level at 78Fib has some solid confluence with a swing low 16270.
Onto Treasuries:
$ZTH6:
Hard to look at this and believe there was a rate hike in December.... Solid trending channel here.
Zooming in a bit, may have missed an opportunity to get long 109'105 off a previous swing zone 109'100. Will now watch resistance at 109'150/'155 for FRT of last lower high.
$ZFH6:
Also has been trending nicely higher; support at EMA may have missed eyes on this one. Again, watching for a FRT between 121'085 - 121'107.
$ZNH6:
130'190 - 130'220 = FRT & resistance zones:
$ZBH6:
A bit stronger than shorter end of the curve, may need to give 164 area a chance to fail first. Thinking the pop over 163'22 could be false BO and trap longs.
$UBH6:
Same as above, as you can see the false BO back on Wed. Looking for over 169'01 and 169'23 area possibly to fade:
Onto Energy:
$CLH6:
A classic BO, then sputter pattern. But patient players wait for the retest of the trendline breakout for entry:
With that in mind, watching this triangle for continuation below the Friday BO; or possible pullback resistance at TL between 31.85-32.00
$NGH6:
Previous false BO gave longs too much hope. Tamer winter crushed them. Watching for the next box breakout, with possible resistance zones: 2.10, then 2.15
$RBH6:
Missed the TL resistance on that pullback thru previous support zones (shaded on left); Not much to do here, but continue to watch for possible FRT off lows under .9800
$HOH6:
Strongest of the energy markets. Nice trending upside. Will watch and wait for potential H&S top near 1.1000.
$BRNJ6:
Cannot trade Brent, but good to keep an eye on it. Also trending nicely as Brent/WTI spread ripped from negative the past few weeks. Watching triangle BO on this one, too.
Will continue with others later.