Well, from last post: http://justbuythefuckingdip.blogspot.com/2015/07/crude-pullback.html
Options spreads went berserk today. Mentioned on chat about $1.62 on CL spreads, USO spreads open $.57.
Peeling off some profits, CL options at $1.62 = $790 per contract, USO at $23 per contract.
As of time of this writing, CL option spread went $2.25 bid, would peel off 1 more $1420 profit; USO @ $.69
Monday, July 6, 2015

Wednesday, July 1, 2015
Crude Pullback
Crude WTI $CLQ5
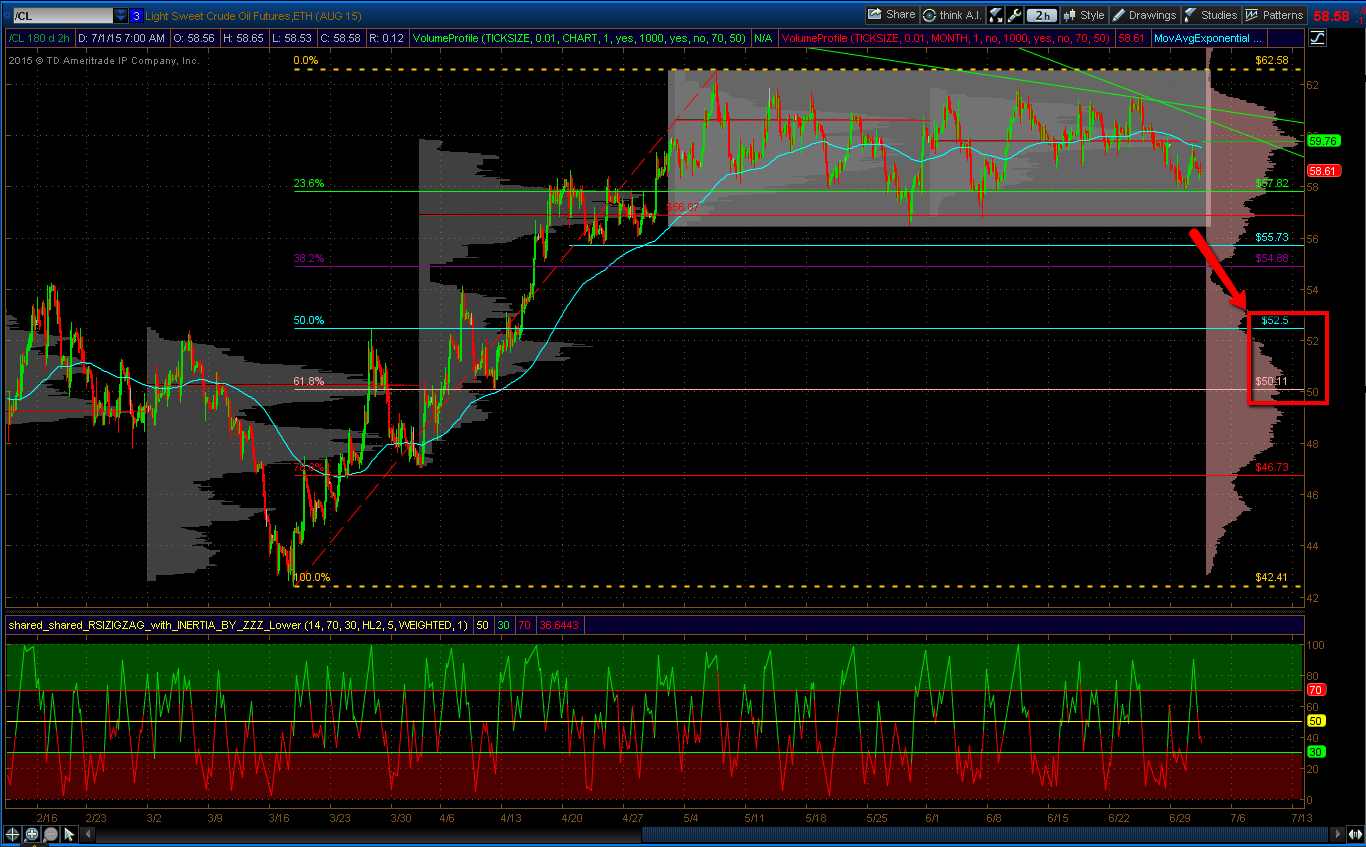
Price certainly boxed in as visible here:
 A break out of this, to lower Fib regions seems logical IF a continuation higher is in the cards to $75.
Two ways to play this idea
1. Long /CLU5 vertical 55/50 Put spread for $.83, $830 per contract. Risk/Reward here:
 2. Long Aug. USO vertical 19.50/18.50 put spread for $.34, $34 per contract. Risk/Reward here:

Price certainly boxed in as visible here:
Two ways to play this idea
1. Long /CLU5 vertical 55/50 Put spread for $.83, $830 per contract. Risk/Reward here:


Monday, June 29, 2015
June 29 Updates
Palladium ($PA) update from here:
 Stop moved to $721.65 capping a gain ($4745 per contract), regardless.
$660 target still not achieved, chart indicates $664.65 target, today's LOD not filled.
Some updates to this post:
- Hogs signal never occurred, therefore no entry.
- Cotton, July contract expired, Dec. contract showed a good buy, but that got away from me.
- OJ missed, thank goodness, probably a loser.
- 6M TL BO worked, but also missed.

June 4 updates:
Oats trade was moving profitable, but target never achieved. Likely B/E trade.
Corn options trade had a very nice move, but didn't track exits closely enough.

$660 target still not achieved, chart indicates $664.65 target, today's LOD not filled.
Some updates to this post:
- Hogs signal never occurred, therefore no entry.
- Cotton, July contract expired, Dec. contract showed a good buy, but that got away from me.
- OJ missed, thank goodness, probably a loser.
- 6M TL BO worked, but also missed.

June 4 updates:
Oats trade was moving profitable, but target never achieved. Likely B/E trade.
Corn options trade had a very nice move, but didn't track exits closely enough.
Thursday, June 4, 2015
June 4, 2015
Oats, July: (/ZON5) *25 days to exp.
Looking like a breakout of this downtrend line:
 Long at reopen, June 3 @ 20:00p.m. $254.00
Risk of trade: below BO swing $242 = $600 per lot
Target #1 2:1 risk:reward = $278.00 --- also confluence at 38.2% Fib. area.
Target #2 would be at 50%Fib, LVN on yearly profile.
Corn, July (ZCN5):
Could this be a potential TL resistance area, and a false BO?
 Will revisit this on reopen, and cash open Friday. Hard to specify risk/reward using fut's... perhaps an options put vertical.
i.e. Long July 360/350 put spread, last 3.875 (risk = $193.75, reward = $306.25)
Like the idea of legging in 3.50 ($175 :: $325)
or 3.00 ($150 :: $350)
360 puts reopen 6.75B/7.50A total risk = $337.5/$375
350 puts reopen 2.75B/3.375A total risk = $137.50/$168.75
Looking like a breakout of this downtrend line:

Risk of trade: below BO swing $242 = $600 per lot
Target #1 2:1 risk:reward = $278.00 --- also confluence at 38.2% Fib. area.
Target #2 would be at 50%Fib, LVN on yearly profile.
Corn, July (ZCN5):
Could this be a potential TL resistance area, and a false BO?

i.e. Long July 360/350 put spread, last 3.875 (risk = $193.75, reward = $306.25)
Like the idea of legging in 3.50 ($175 :: $325)
or 3.00 ($150 :: $350)
360 puts reopen 6.75B/7.50A total risk = $337.5/$375
350 puts reopen 2.75B/3.375A total risk = $137.50/$168.75
Wednesday, June 3, 2015
Palladium Breakout
The breakout occurred yesterday, June 2. Basing the confirmation on the previous day's close, the reopen signal comes at 769.1 - target 660.00 on a measured move of the triangle depth.
 Risk comes at top of triangle breakout ~ 25.9 pts (518 ticks = $2590)
Reward = 109.1 (2182 ticks = $10,910)

Reward = 109.1 (2182 ticks = $10,910)
Wednesday, May 27, 2015
May 27 Ideas
Some daily chart views.
Lean Hogs:
Inverse H&S setting up. Watch for a close over 85.15.
 Cotton No. 2:
Channel buy at 62.00, stop probably safe @ 61.00
 FCOJA:
Trendline resistance near 120.00
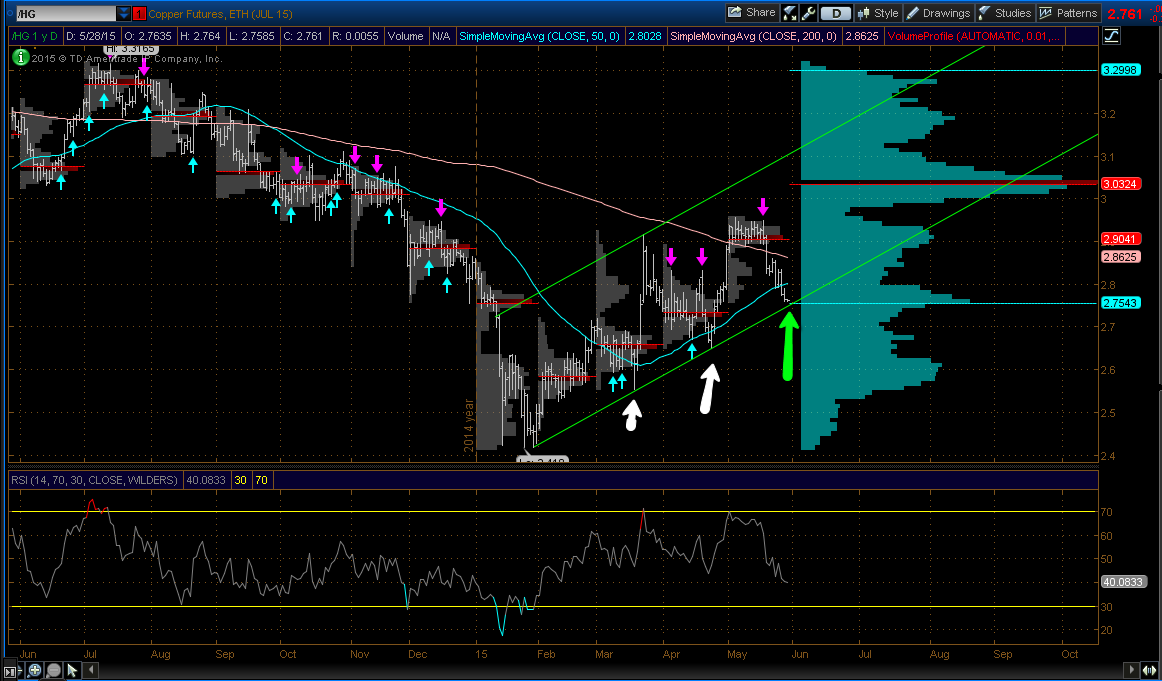
 Copper:
Channel buy ~ 2.7543 area.
 Possibly ETF options play:
 USD/MXN - 6M:
Trendline breakout idea:
 Palladium:
Triangle BO.
 Nasdaq:
Geometric extension target 4600.

Lean Hogs:
Inverse H&S setting up. Watch for a close over 85.15.

Channel buy at 62.00, stop probably safe @ 61.00

Trendline resistance near 120.00

Channel buy ~ 2.7543 area.

Trendline breakout idea:

Triangle BO.

Geometric extension target 4600.

Friday, December 19, 2014
CL Iron Condor
Thinking about selling an iron condor in the front month /CL options.
The logic: big, sweeping moves, bottom pickers kept getting clipped, week after week, almost day after day. Starting to think there will be a balancing range around $55 level. The only concern with the futures options is the length of the expiry, 26 days. May have to look at weekly USO options to consider an alternate, less risky strategy.
A view of the range (in pink) of the breakeven.
 The trade:
SELL 3 Feb. 59.00 Calls,
BUY 3 Feb. 59.50 Calls,
SELL 3 Feb. 54.00 Puts,
BUY 3 Feb. 53.50 Puts,
Net credit of $.35.
View of the trade risk/reward:

The logic: big, sweeping moves, bottom pickers kept getting clipped, week after week, almost day after day. Starting to think there will be a balancing range around $55 level. The only concern with the futures options is the length of the expiry, 26 days. May have to look at weekly USO options to consider an alternate, less risky strategy.
A view of the range (in pink) of the breakeven.
SELL 3 Feb. 59.00 Calls,
BUY 3 Feb. 59.50 Calls,
SELL 3 Feb. 54.00 Puts,
BUY 3 Feb. 53.50 Puts,
Net credit of $.35.
View of the trade risk/reward:
Subscribe to:
Posts (Atom)